

The Power of Graphical Conceptual Site Models in Early Contaminated Land Investigations
- Christian Atkinson
- Aug 5, 2025
- 2 min read
In the early stages of contaminated land investigations, producing a graphical Conceptual Site Model (CSM) is one of the most effective ways to understand and communicate site conditions. More than just a Source-Pathway-Receptor (S-P-R) linkage diagram, a graphical CSM is a strategic tool that visually integrates spatial and environmental data to guide sampling and decision-making.
What Should a Graphical CSM Include?
A well-constructed graphical CSM typically comprises:
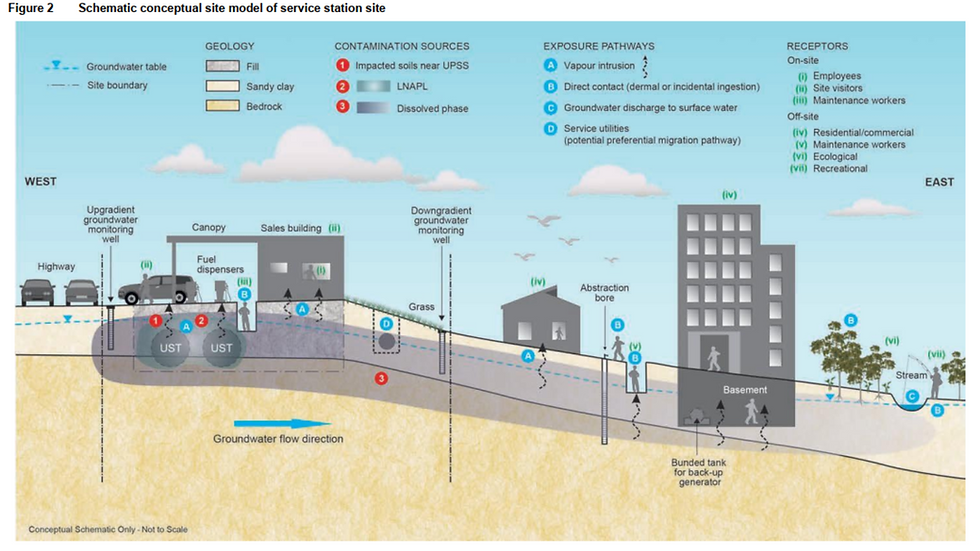
Sources of contamination: These may include underground storage tanks (USTs), pits, sumps, or above-ground sources such as chemical drums or fuel dispensers.
Site layout and infrastructure: Including buildings, paved areas, drainage systems, and historical land uses.
Soil types and geology: Stratigraphy and permeability characteristics that influence contaminant migration.
Groundwater levels and flow direction: Essential for understanding potential plume movement.
Land slope and surface drainage: Which affect surface water runoff and infiltration.
Surrounding receptors: Such as nearby residences, schools, water bodies, and ecological habitats.
These elements are typically presented in plan view and cross-section diagrams, which can be hand-drawn or digitally rendered. The goal is to show the physical relationships between contamination sources and the receiving environment, helping consultants identify priority areas for sampling and further investigation. Below is an example of a detailed cross-sectional CSM diagram.
Why Early Graphical CSMs Are Essential
Early-stage graphical CSMs help:
Clarify site dynamics and potential exposure pathways.
Inform sampling strategies by highlighting areas of concern.
Identify data gaps and uncertainties in site understanding.
Support risk assessments by visualising plausible pollutant linkages.
They also serve as a communication tool between consultants, auditors, regulators, and stakeholders, ensuring everyone shares a common understanding of the site.
Regulatory Guidance
The importance of graphical CSMs is reinforced by several key regulatory documents:
ASC NEPM (Schedule B2): Emphasises the need for iterative CSMs that evolve with new data. It encourages visual representations to support understanding and decision-making.
PFAS NEMP 3.0: Recommends graphical SPR models to assess PFAS risks and guide remediation planning.
NSW EPA Technical Notes: Particularly for service station sites, these notes advocate for graphical CSMs to illustrate subsurface infrastructure, contamination plumes, and receptor proximity.
Final Thoughts
Graphical CSMs are more than compliance tools—they are essential thinking aids. By integrating spatial, geological, and environmental data into a coherent visual format, they help consultants make informed decisions and communicate findings effectively. Investing time in developing a graphical CSM early in the investigation pays dividends throughout the assessment and remediation process.

Christian Atkinson is a contaminated land auditor and a suitably qualified person for contaminated land assessment in Queensland with more than 30 years of experience. Any discussion is general and does not consider your specific circumstances. If you are considering acting on any matters discussed, you should seek advice from qualified and experienced professionals.


Comments